Prometheus is the most popular monitoring solution today. It can scrape metrics from various targets and store them in a time series database, providing flexible aggregation and query capabilities. This article attempts to organize the storage and indexing structure of Prometheus, understanding how it supports complex aggregation queries.
Storage of Time Series Data
In Prometheus’s presentation, the design of TSDB storage has these challenges:
- Metric data follows a “Writes are vertical, reads are horizontal” pattern;
- High churn: In a cloud-native environment, a large number of temporary time series are generated;
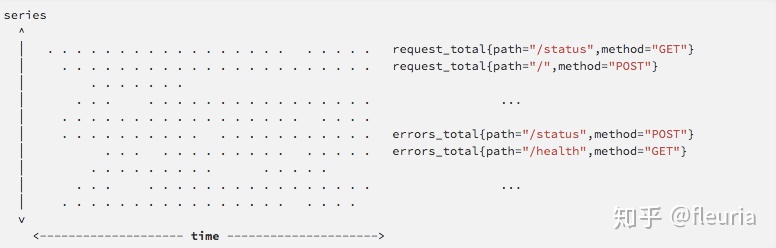
“Writes are vertical, reads are horizontal” means that TSDB usually collects metrics at fixed intervals and writes them in. It “vertically” writes data for all recent time series, while read operations often target one or multiple time series over a certain time range, “horizontally” spanning time for queries:
Given this, Prometheus’s write path is similar to LSM Tree. It buffers data until a batch is ready to be written to disk, ensuring that a segment of a single time series’s chunk is adjacent in storage, allowing for relatively fast horizontal reads of time series data. Prometheus TSDB compresses each chunk like Gorilla, reducing the storage cost of a single monitoring data point to about 1.4 bytes. This is similar to columnar storage design, where compression not only optimizes storage costs but also significantly accelerates computation.
The “high churn” phenomenon makes the approach of Graphite, where each time series has its own file, less sustainable. Each pod in Kubernetes generates a standalone time series, and each start and stop creates a file, easily exhausting the inodes of the system. Additionally, frequent opening and closing of files for queries is not efficient. Prometheus v1’s storage architecture still used one file per time series, but in v2, it underwent a major refactor, switching to a block structure, where each block contains all time series data and indexes for the past two hours, accessed via mmap. Each block essentially acts as a small, independent database, storing all time series chunks and indexes within that two-hour period.
The directory structure of v2 looks something like this:
$ tree ./data
./data
├── b-000001
│   ├── chunks
│   │   ├── 000001
│   │   ├── 000002
│   │   └── 000003
│   ├── index
│   └── meta.json
├── b-000004
│   ├── chunks
│   │   └── 000001
│   ├── index
│   └── meta.json
├── b-000005
│   ├── chunks
│   │   └── 000001
│   ├── index
│   └── meta.json
└── b-000006
    ├── meta.json
    └── wal
        ├── 000001
        ├── 000002
        └── 000003
The storage of time series data in each block looks roughly like this:
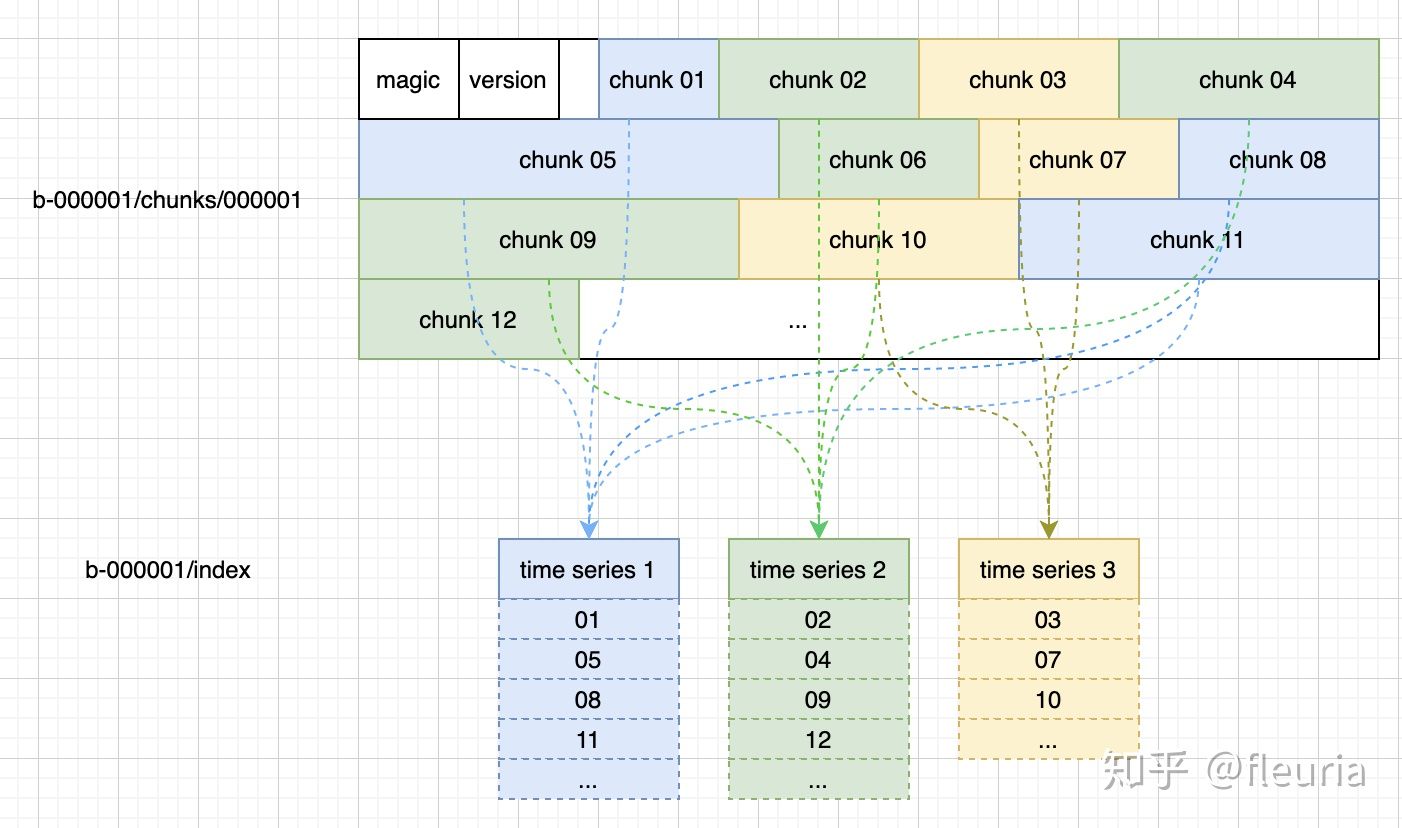
Each chunk can be understood as a KV data in a KV store, forming complete time series data according to the list of chunk IDs in the index.
Index Structure
The index file in each block contains these parts:
- Symbol table: A dictionary where each label name and label value is recorded as a unique ID, with only the ID values stored.
- Series list: Records which series are in the current block, each series’s label values, and which chunks it has, including the start and end times of each chunk.
- Inverted index (posting): An inverted index from each label value to a list of series IDs.
- Inverted index offset table: The starting offset of each inverted list.
- TOC: The starting offset of each part in the index file.
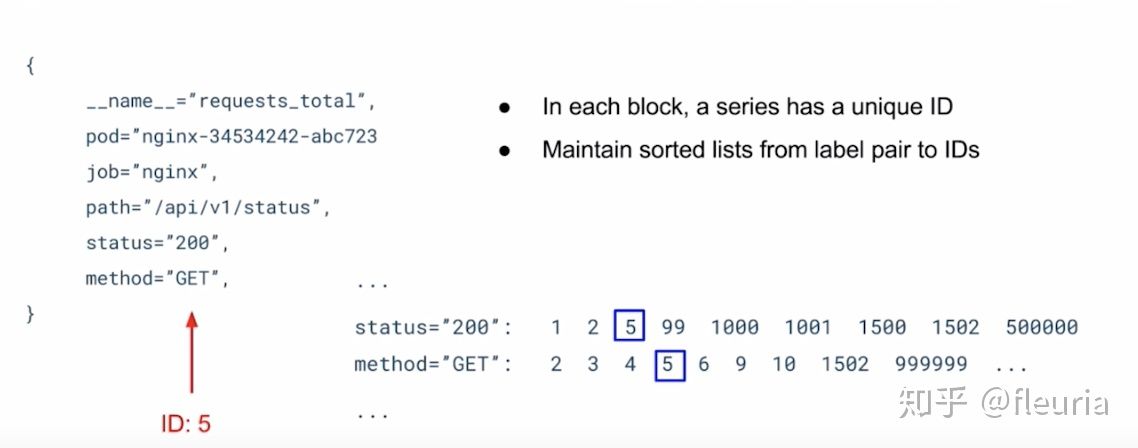
Prometheus’s ability to perform flexible filtering and aggregation based on labels is due to the inverted index. Each inverted index is a sorted list of IDs, allowing efficient intersection and union operations:
Summary
- Prometheus’s storage concept is most influenced by Gorilla, compressing time series data to save storage and accelerate computation.
- v2 storage uses a two-hour block structure to store all time series data within that period, further dividing time series data into chunks, which are indexed to form complete time series data.
- The index of labels is an inverted index structure, which is the basis for flexible aggregation queries.